xdebug讲到了使用xdebug对php程序进行性能分析,这里再介绍另外一个工具:xhprof,facebook出品。xhprof是一个函数级别的分层性能报告工具,包括调用次数,阻塞时间,CPU时间和内存使用情况。
首先,下载并安装xhprof扩展:
tar -zxvf xhprof-0.9.4.tgz
cd xhprof-0.9.4
/usr/local/php/bin/phpize
./configure --with-php-config=/usr/local/php/bin/php-config
make
make install
#拷贝扩展
cp /usr/local/php/lib/php/extensions/no-debug-non-zts-20100525/xhprof.so /usr/local/php/lib/php/extensions/

mkdir -p /tmp/xhprof
chmod 755 /tmp/xhprof
chown www:www /tmp/xhprof
xhprof自带的界面工具比较简单,这里推荐使用另外一个UI:XHProf.io。下载解压到web目录下面,重命名/xhprof/includes/目录下的config.inc.sample.php为/xhprof/includes/config.inc.php,并更改文件:
return array(
	'url_base' => 'http://192.168.84.2:8502/', //本地的XHProf.io站点
	'url_static' => null, // When undefined, it defaults to $config['url_base'] . 'public/'. This should be absolute URL.
	'pdo' => new PDO('mysql:dbname=test;host=192.168.84.3;charset=utf8', 'root', 'root') //本地的数据库配置,只支持PDO
);
在test数据库上运行/xhprof/setup/database.sql,创建性能检测相关的表结构。
由于XHProf会去github上检测版本,国内访问较慢,建议不要检测。更改/xhprof/includes/bootstrap.inc.php如下:
	curl_setopt_array($ch, array(
		CURLOPT_URL => 'http://192.168.84.2:8502/version.json', //本地的XHProf.io站点下面
		CURLOPT_HEADER => FALSE,
		CURLOPT_RETURNTRANSFER => TRUE
	));
然后更改php.ini配置,在最后加上以下内容:
;xhprof
[xhprof]
extension=xhprof.so;
xhprof.output_dir=/tmp/xhprof

; Automatically add files before PHP document.
; XHProf.io站点下的prepend.php
auto_prepend_file = /usr/local/nginx/xhprof/inc/prepend.php

; Automatically add files after PHP document.
; XHProf.io站点下的append.php
auto_append_file = /usr/local/nginx/xhprof/inc/append.php
auto_prepend_file为每次php脚本运行前,自动加载并运行的文件;auto_append_file为每次php脚本运行后,自动加载并运行的文件。这样可以省去每次在需要检测的php文件里面写xhprof_enable/xhprof_disable等调用代码,不必更改原有代码(无侵入)。
注意:如果你访问了php页面却收集不到情况,可能是你的代码里面写了exit/die终止了程序执行,导致auto_append_file未加载执行,去掉exit/die就可以了。另外,如果提示:Unexpected system behaviour,可能是数据库连接不上,PDO、mbstring扩展未安装,响应数据里面带有错误信息的等等。
重启php-fpm:
#重启php-fpm
kill -USR2 `cat /usr/local/php/var/run/php-fpm.pid`
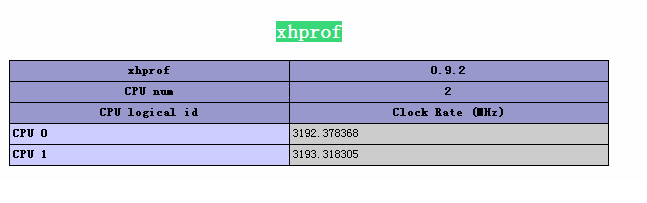
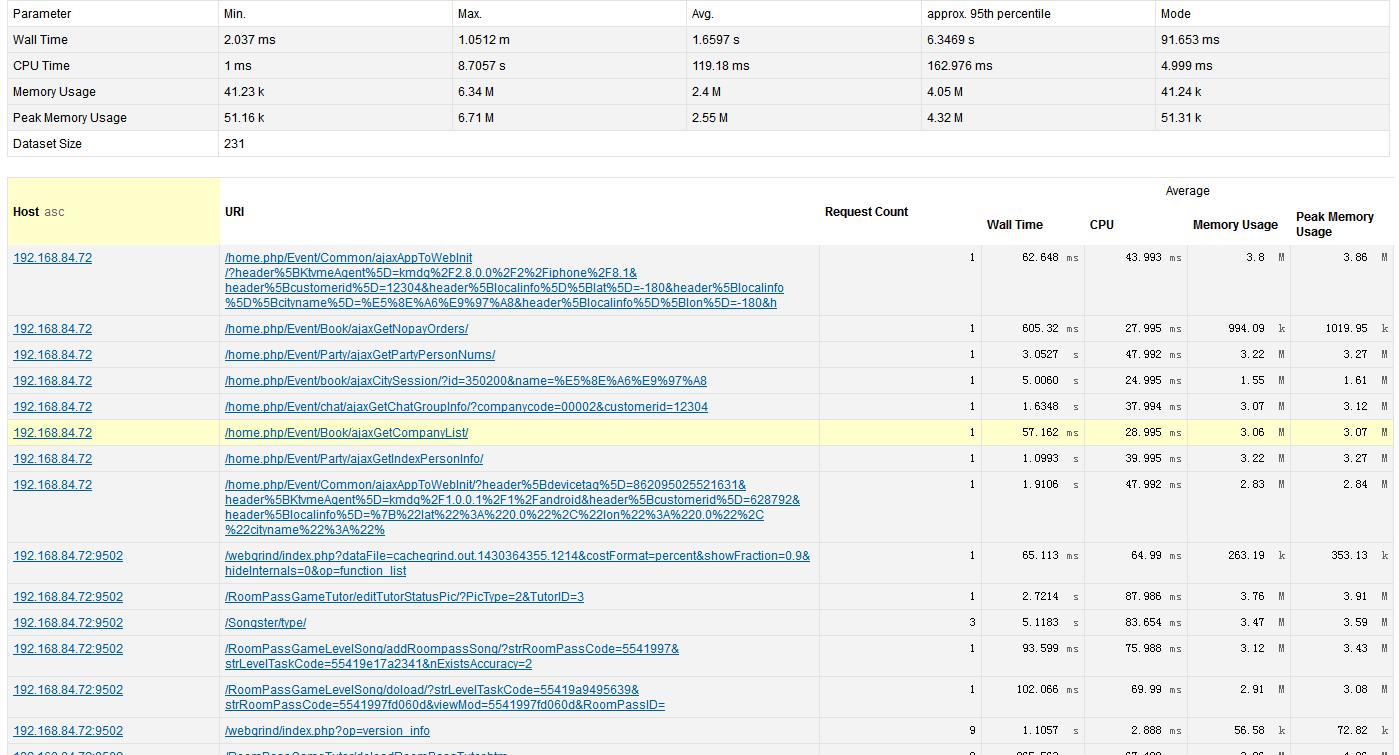
访问该服务器上php页面,即可以在http://192.168.84.2:8502/看到检测情况。
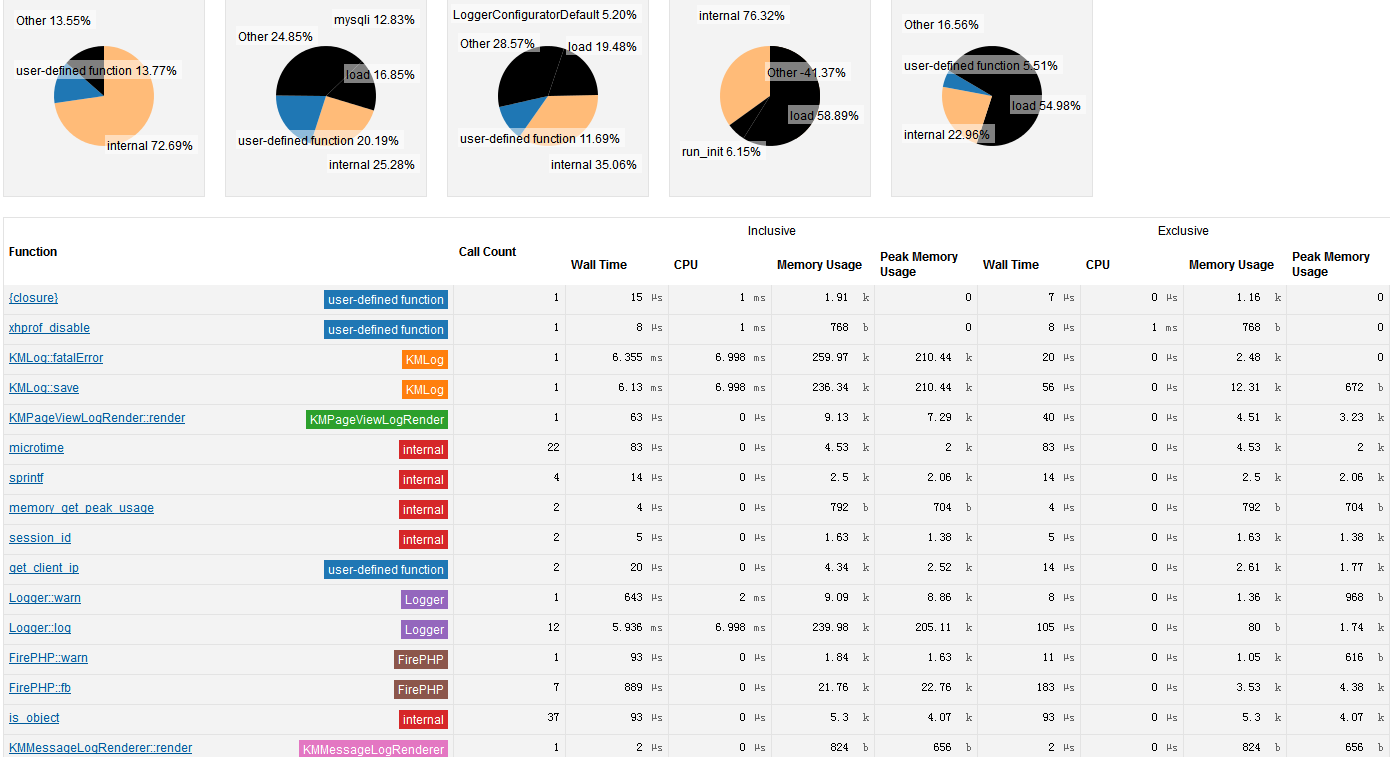
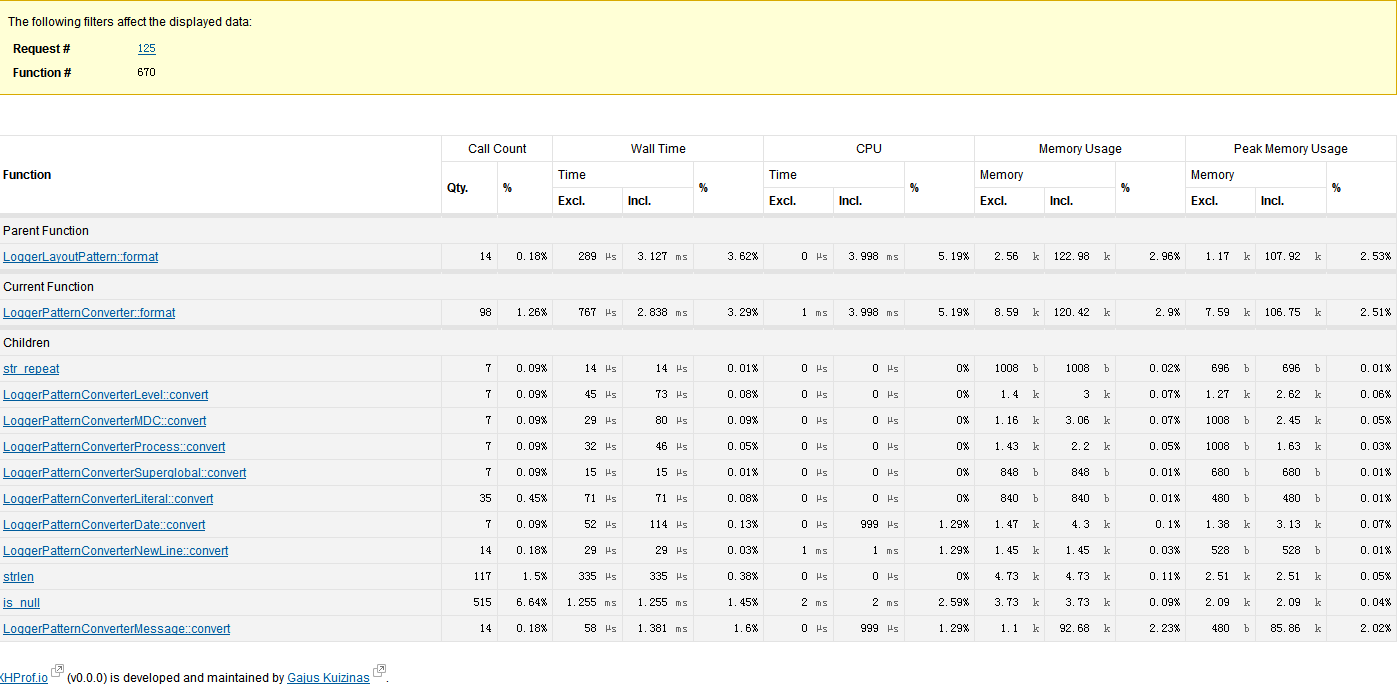
参数说明
Inclusive Time 包括子函数所有执行时间。
Exclusive Time/Self Time 函数执行本身花费的时间,不包括子树执行时间。
Wall Time 花去了的时间或挂钟时间。
CPU Time 用户耗的时间+内核耗的时间
Inclusive CPU 包括子函数一起所占用的CPU
Exclusive CPU 函数自身所占用的CPU
参考链接:
给CentOS6.3 + PHP5.3 安装PHP性能测试工具 XHProf-0.9.2
xhprof.io/INSTALL.md
php auto_append_file